Maintaining accurate and up-to-date records of fixed assets is crucial for any organization. Fixed asset reconciliation is a process that ensures the physical assets of a company match the records in the General Ledger.
This tutorial provides a comprehensive guide to constructing three essential queries for fixed asset reconciliation, particularly focusing on IT inventory. By following this tutorial, you’ll learn how to enhance your General Ledger’s capabilities with outside data and build an effective IT inventory template.
Table of Contents
ToggleUnderstanding the General Ledger
The General Ledger is the backbone of any financial system, recording all the transactions and purchases made by a firm. It is the starting point for our fixed asset reconciliation process, as it contains the primary data we need to verify against physical assets.
Constructing the Queries
1. How is the cost distributed among different vendors?
This query helps understand how procurement funds are distributed among different vendors. By analyzing the cost breakdown, a company can make informed decisions about vendor management and cost optimization.
First, gather all the relevant financial data from your General Ledger that pertains to vendor payments. This data should include the amount spent, the vendor’s name, and the date of each transaction.
Next, organize the expenses by vendor, grouping all payments made to each vendor together so you can analyze them as a single entity.
Once you have categorized the expenses, calculate the total amount spent for each vendor over a specific period, such as a month, quarter, or year. This gives you a clear picture of how much money is going to each supplier. To understand the distribution, calculate the percentage of the total spending that each vendor represents. For example, if you spent a total of $100,000 and Vendor A received $25,000, then Vendor A represents 25% of your total spending.
After determining the percentages, look for patterns in your spending.
Are there certain vendors that consistently receive a large portion of your budget?
Are there vendors whose share of your spending has been increasing or decreasing over time?
Based on your findings, assess whether you are getting the best value from each vendor.
Consider renegotiating contracts or exploring alternative suppliers if you find that the cost distribution is not aligned with your company’s priorities or budget goals.
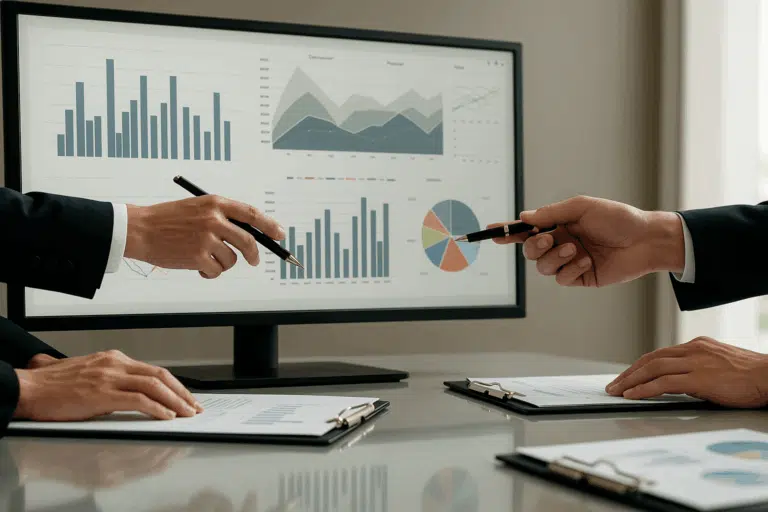
Finally, use charts and graphs to visually represent the cost distribution among vendors. This can make it easier to understand and communicate your findings to other stakeholders in your organization.
Regularly review and update this analysis to monitor changes in your vendor cost distribution. This will help you stay on top of your expenses and make informed decisions about vendor management.
By thoroughly analyzing how costs are distributed among different vendors, you can identify opportunities for cost optimization, strengthen your negotiating position with suppliers, and ensure that your spending aligns with your company’s strategic objectives.
2. What is the cost distribution for specific types of IT assets?
To answer this question, we need to extend the General Ledger with an Asset-Type column. This involves creating a lookup table that maps each asset to its type, which can be done manually or through vendor cooperation. The goal is to categorize assets efficiently, even as the ledger scales.
Start by identifying all the types of IT assets your organization owns or leases, such as hardware (e.g., laptops, servers, networking equipment), software (e.g., operating systems, productivity tools, security software), and services (e.g., cloud storage, software-as-a-service subscriptions).
Once you have a clear list of asset types, gather data on the purchase or leasing costs associated with each IT asset. This information can typically be found in your company’s General Ledger, purchase orders, or asset management system. Be sure to include all relevant costs, such as initial purchase price, maintenance fees, licensing costs, and any other expenses related to the asset.
Next, categorize each IT asset into its corresponding category, grouping similar assets together. For example, group all laptops under “Hardware – Laptops,” all antivirus software under “Software – Security,” and so on. Once the assets are categorized, calculate the total cost of all assets within each category.
This will give you the total expenditure for each type of IT asset.
To understand the distribution of costs, calculate the percentage of the overall IT budget that each category represents. For instance, if your total IT budget is $500,000 and you spent $100,000 on laptops, then “Hardware – Laptops” accounts for 20% of your IT budget. Analyze the results to identify trends and insights. Are certain types of assets consuming a disproportionately large portion of your budget? Are there areas where you might be overspending or underspending?
Visualize the data by creating charts or graphs to represent the cost distribution among different IT asset types. This can help you and other stakeholders quickly grasp the allocation of IT spending. Finally, regularly review the cost distribution to ensure it aligns with your organization’s strategic priorities and goals.
Adjust your IT asset management and procurement strategies as needed to optimize costs and maximize value.
By conducting a thorough analysis of the cost distribution for specific types of IT assets, you can gain valuable insights into your IT spending patterns. This information can help you make informed decisions about budget allocation, asset procurement, and overall IT asset management strategy.
3. How does the cost of each IT asset type vary across different cost centers?
This query takes the reconciliation process a step further by incorporating real-time location information about assets. It requires linking the General Ledger with the Fixed Asset Register using a unique identifier, such as a Pre-Applied Barcode. This connection allows for a detailed analysis of asset allocation across different cost centers.
You need to define your cost centers. Cost centers are typically departments or business units within an organization that incur costs but do not directly generate revenue. Examples might include IT Helpdesk, Human Resources, Marketing, Research and Development, and Operations.
Once you have identified your cost centers, you need to gather detailed data on the IT assets allocated to each center. This data should include the type of asset (e.g., laptops, servers, software licenses), the cost of each asset, and the cost center to which it is assigned.
Next, categorize the IT assets within each cost center. Group similar assets together to simplify the analysis. For example, you might have categories like “Hardware – Laptops,” “Software – Productivity,” and “Services – Cloud Storage.” Within each cost center, calculate the total cost for each category of IT assets. This will give you a clear picture of how much each cost center is spending on different types of IT assets.
Once you have the total costs, analyze the data to understand how the cost distribution varies across cost centers. Are certain cost centers investing more heavily in specific types of IT assets? For example, the Marketing department might have a higher expenditure on graphic design software, while the IT Helpdesk might allocate more of its budget to hardware and support tools.
Visualize the data using charts or graphs to make the cost distribution across cost centers more comprehensible. This visualization can help stakeholders quickly grasp the allocation of IT spending across the organization.
Finally, use the insights gained from this analysis to inform decision-making. Understanding how the cost of each IT asset type varies across different cost centers can help you identify opportunities for reallocating resources, negotiating better deals with vendors, and optimizing IT asset utilization to align with organizational goals and priorities.
By conducting this in-depth analysis, you can gain a comprehensive understanding of how different cost centers within your organization allocate their budgets to various IT assets. This knowledge can be invaluable in driving strategic decisions around IT asset management and budgeting.
IT Inventory Template

The culmination of this process is the creation of an IT Inventory Template. This template serves as a tool for physically collecting information about assets in the enterprise’s facilities. It is crucial for validating the General Ledger through fixed asset reconciliation.
Regular updates to the Asset Repository and Fixed Asset Register are recommended to maintain accuracy.
Conclusion
Mastering fixed asset reconciliation queries provides asset managers with invaluable insights into the asset landscape, empowering them to make strategic decisions regarding procurement, cost-benefit analysis, and productivity maximization.
While the SQL statements for these queries are beyond the scope of this document, we encourage you to explore the attached Access database and examine the SQL code behind the queries.
By implementing these queries and maintaining a robust IT Inventory Template, organizations can ensure the integrity of their fixed asset records and optimize their IT asset management practices.


